
The List Price
When we talk about the price of insulin, we are referring to the “list price” of analog insulin. The list price is the price set by the manufacturer that drives all other costs within the drug pricing ecosystem. It is not necessarily the cost an individual pays when picking up their insulin at a pharmacy, due to the variety of insurance coverage schemes.
However, patients are exposed to the list price of insulin when:
they are uninsured,
are subject to a deductible,
are subject to co-insurance on drugs,
the insulin they use is not on their insurance’s formulary,
or, are within the Medicare Part D coverage gap
“When we need insulin or we die, patients have no choice but to pay. And, for many patients, that price is the list price of insulin.”
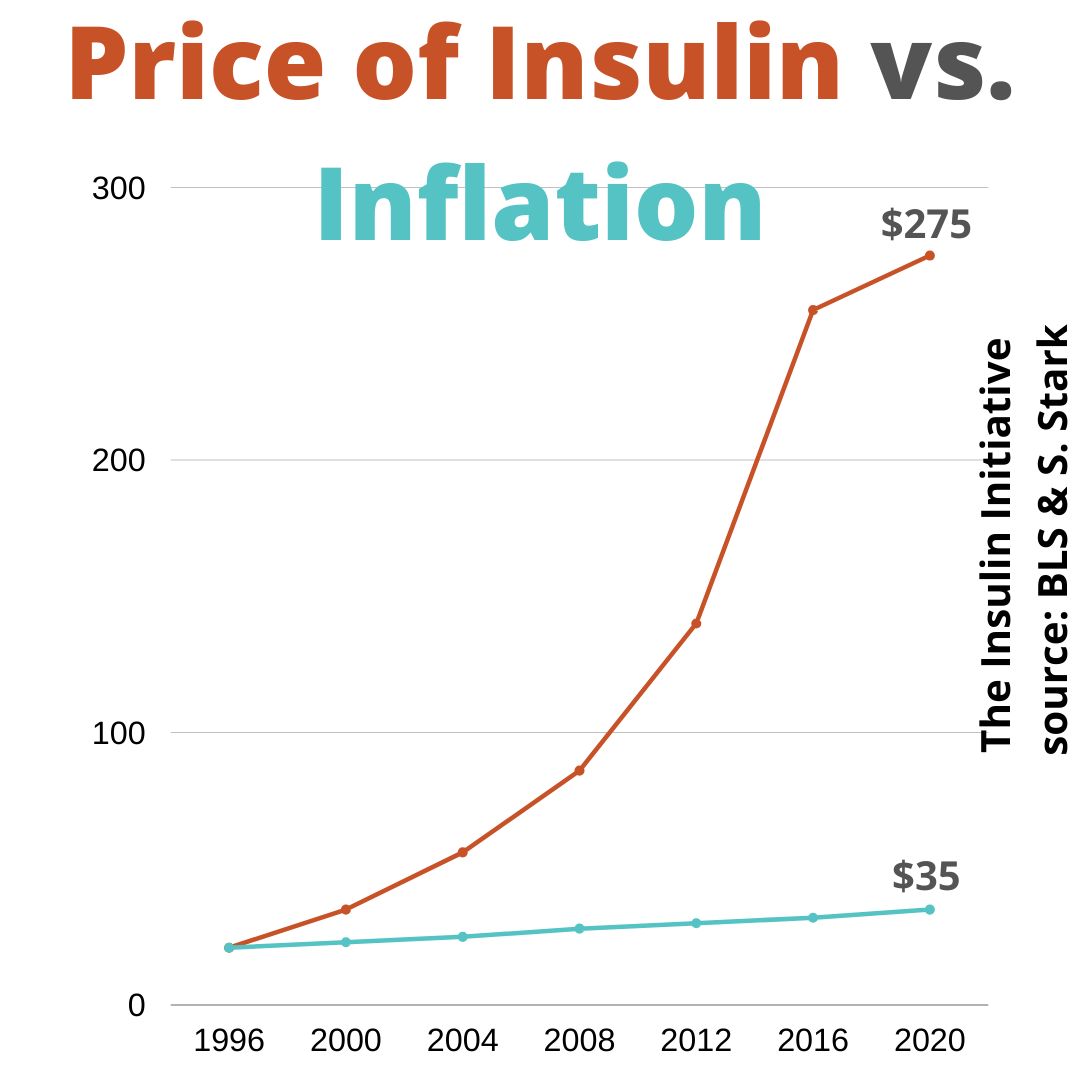
The list price of a vial of Humalog insulin has increased from $21 in 1996 to $275 in 2017, a ~1200% increase. This insulin has not changed at all during this time period. Since 2017, the list price of Humalog insulin has remained unchanged, due to pressure from advocates. We know that the insulin manufacturers have raised the price of all insulins in lockstep with one another.
Our graph below visualizes the price increase (percentage change since 1996) of insulin versus inflation (All Items) and other necessary goods for survival. If the price of insulin had been increased at the same rate of inflation, a vial of Humalog insulin would be $35 today.
We used data from the Bureau of Labor Statistics “Consumer Price Index - All Urban Consumers” as the source for pricing information on the goods and services other than insulin. The following Series IDs were pulled.
All Items - CUUR0000SA0
Childcare - CUUR0000SEEB03
College Tuition - CUUR0000SEEB01
Food and Beverage - CUUR0000SAF
Hospital Services - CUUR0000SEMD
Housing (Shelter) - CUUR0000SAH1
Medical Care Services - CUUR0000SAM2
Prescription Drugs - CUUR0000SEMF01
Utilities - CUUR0000SAH2
For the insulin prices, since this is not publicly available information, long-time insulin advocate, Sarah Stark reversed engineered the price data using price graphs published by the media. Stark’s methodology to obtain this price data is located here.
Our code to analyze the data and create the graph can be found here.
Share on Instagram